http://www.sqler.com/bColumn/872290
SQL Server 트랜잭션 로그 읽기
- Version : SQL Server 2005, 2008, 2008R2, 2012
데이터베이스에서 발생하는 행위는 트랜잭션 로그 라는 곳에 기록된다. 문서화되지 않은 기능 fn_dblog 함수를 사용하여 트랜잭션 로그의 정보를 읽어보자.
Fn_dblog는 트랜잭션의 시작 LSN과 종료 LSN을 필요로 한다. NULL은 기본값으로 트랜잭션 로그 파일의 모든 로그 레코드를 반환한다.
실습을 위해 데이터베이스를 생성한다.
--Create DB. USE [master]; GO CREATE DATABASE ReadingDBLog; GO -- Create tables. USE ReadingDBLog; GO CREATE TABLE [Location] ( [Sr.No] INT IDENTITY, [Date] DATETIME DEFAULT GETDATE (), [City] CHAR (25) DEFAULT 'Seoul'); |
다음 스크립트를 실행하여 데이터베이스 및 테이블을 작성하는데 걸린 어떤 과정과 단계를 확인할 수 있다.
USE ReadingDBLog; GO select COUNT(*) from fn_dblog(null,null) |

데이터베이스 생성과 테이블을 생성하는데 총 176행의 정보가 생성된 것을 확인 할 수 있다. 다음 스크립트를 통해 데이터베이스 생성, 테이블 생성에 기록된 트랜잭션 로그 파일 데이터를 확인하여 보자.
USE ReadingDBLog; GO select [Current LSN], [Operation], [Transaction Name], [Transaction ID], [Transaction SID], [SPID], [Begin Time] FROM fn_dblog(null,null) |

LOP_BEGIN_XACT는 트랜잭션의 시작을 의미한다. 작업 열은 우리가 삽입, 업데이트, 삭제, 축소, 잠금, 페이지 할당 등과 같이 수행되는 작업을 알려준다.
데이터의 삽입, 업데이트, 삭제 등의 DML 스크립트를 사용하여 트랜잭션 로그 파일에 기록하는 방법을 확인하여 보자. 이 작업을 수행하는 동안 페이지가 할당 또는 해제되는 방법을 추적할 수 있다.
USE ReadingDBLog go INSERT INTO Location DEFAULT VALUES ; GO 100 GO UPDATE Location SET City='New Delhi' WHERE [Sr.No]<5 GO DELETE Location WHERE [Sr.No]>90 Go |
데이터 입력 수정, 삭제가 완료되었으면 트랜잭션 로그 파일을 확인해 보자.
USE ReadingDBLog go SELECT [Current LSN], [Transaction ID], [Operation], [Transaction Name], [CONTEXT], [AllocUnitName], [Page ID], [Slot ID], [Begin Time], [End Time], [Number of Locks], [Lock Information] FROM sys.fn_dblog(NULL,NULL) WHERE Operation IN ('LOP_INSERT_ROWS','LOP_MODIFY_ROW', 'LOP_DELETE_ROWS','LOP_BEGIN_XACT','LOP_COMMIT_XACT') |

트랜잭션을 시작하고 힙테이블 dbo.location 에 데이터를 입력하고 트랜잭션을 완료하는 것을 확인 할 수 있다. UPDATE문과 DELETE 구문도 확인 할 수 있다.
트랜잭션 로그에서 SQL Server의 페이지 분할이나 페이지 분할 횟수 등 내부 동작도 확인할 수 있다.
다음 스크립트를 실행하여 스플릿 정보를 확인한다.
USE ReadingDBLog go --Get how many times page split occurs. SELECT [Current LSN], [Transaction ID], [Operation], [Transaction Name], [CONTEXT], [AllocUnitName], [Page ID], [Slot ID], [Begin Time], [End Time], [Number of Locks], [Lock Information] FROM sys.fn_dblog(NULL,NULL) WHERE [Transaction Name]='SplitPage' GO |

위에서 확인된 스플릿의 트랜잭션ID를 사용하여 추적할 수 있다.
--Get what all steps SQL Server performs during a single Page Split occurrence. SELECT [Current LSN], [Transaction ID], [Operation], [Transaction Name], [CONTEXT], [AllocUnitName], [Page ID], [Slot ID], [Begin Time], [End Time], [Number of Locks], [Lock Information] FROM sys.fn_dblog(NULL,NULL) WHERE [Transaction ID]='0000:000002dd' |

트랜잭션 로그는 백업의 상호 관계에서는 백업을 진행 할 경우 트랜잭션 로그가 잘리게되어 로그 파일을 축소 할 수 있다.
다음 스크립트를 통하여 백업 후 트랜잭션 로그의 행 숫자가 줄어든 것을 확인 할 수 있다.
SELECT COUNT(*) FROM fn_dblog(null,null) GO
BACKUP DATABASE ReadingDBLog TO DISK = 'c:\SQL_DATA\ReadingDBLog_Full.bak' GO
SELECT COUNT(*) FROM fn_dblog(null,null) GO |

[참고자료]
http://www.mssqltips.com/sqlservertip/3076/how-to-read-the-sql-server-database-transaction-log/
------------------------------------------------------------------------------------------------------------------------
Problem
Have you ever wondered how SQL Server logs track transactions and what information SQL Server captures in the transaction log file? In this tip we will take a look at a SQL Server function that you can use to read the transaction log to see what entries are made for database transactions.
Solution
I will explain how to read your database transaction log file and how transactions are written for your database if you perform any database activity. This tip is helpful if you want to know what the transaction log file captures. There is an undocumented function called "fn_dblog" which enables you to read data from your transaction log which contains very informative data about things that are happening in your database. I strongly suggest testing any undocumented features in a lab environment first.
The function (fn_dblog) requires a beginning LSN and ending LSN for a transaction. NULL is the default for this function and this will return all log records from the transaction log file.
Create a Test Database
To show how this works, we will create a database and a table to play with this function. Run the below SQL code to create a database and table.
--Create DB.
USE [master];
GO
CREATE DATABASE ReadingDBLog;
GO
-- Create tables.
USE ReadingDBLog;
GO
CREATE TABLE [Location] (
    [Sr.No] INT IDENTITY,
    [Date] DATETIME DEFAULT GETDATE (),
    [City] CHAR (25) DEFAULT 'Bangalore');
We have created a database named "ReadingDBLog" and a table 'Location' with three columns. Now you can check all information and processes which have been used by SQL Server to create the database and table. We will run the below code to check the log file for this newly created database to check what processes and steps SQL Server took to create the database and table.
USE ReadingDBLog;
GO
select COUNT(*) from fn_dblog(null,null)
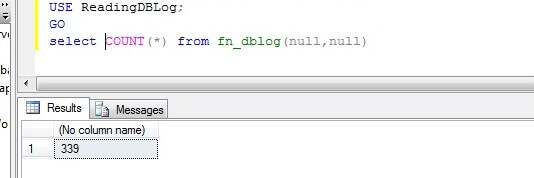
We can see there are 339 rows that have been generated for just creating a dummy database and a blank table. You can go and check the logs by using this function to get details for all processes used to create the database and table. Look at the below code to see the data in the transaction log file.
USE ReadingDBLog;
GO
select [Current LSN],
       [Operation],
       [Transaction Name],
       [Transaction ID],
       [Transaction SID],
       [SPID],
       [Begin Time]
FROM   fn_dblog(null,null)
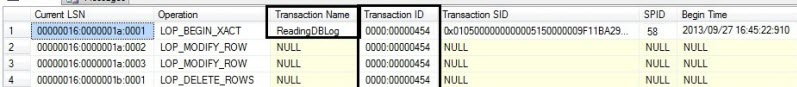
As the total number of rows and columns are large, I gave a snapshot of some of the columns and rows but I have tried to capture a few informative columns here. You can see in the above screenshot that the transaction name column shows the database name, similarly it will show the create table for the table creation code. Transaction ID is the same for all parts of a transaction. The value for transaction name will be filled only when the particular transaction starts with "LOP_BEGIN_XACT" in the Operation column. "LOP_BEGIN_XACT" means begin transaction. The operation column will let us know which operation is performing like an insert, update, delete, shrink, lock, page allocation etc... It is pretty easy to understand the operation based on these key words to see what operation is being performed by SQL Server.
Run some DML commands to see what is captured
Now we will run a few DML scripts to check how data insertion, updating or deletion is logged in the database log file. During this operation you can also track how a page is allocated or de-allocated.
USE ReadingDBLog
go
INSERT INTO Location DEFAULT VALUES ;
GO 100
GO
UPDATE Location
SET City='New Delhi'
WHERE [Sr.No]<5
GO
DELETE Location
WHERE [Sr.No]>90
Go
Let's check our database log file again. As we saw from above, there is a lot of info logged in the transaction log file, so I will filter the data.
USE ReadingDBLog
go
SELECT
 [Current LSN],
 [Transaction ID],
 [Operation],
  [Transaction Name],
 [CONTEXT],
 [AllocUnitName],
 [Page ID],
 [Slot ID],
 [Begin Time],
 [End Time],
 [Number of Locks],
 [Lock Information]
FROM sys.fn_dblog(NULL,NULL)
WHERE Operation IN
   ('LOP_INSERT_ROWS','LOP_MODIFY_ROW',
    'LOP_DELETE_ROWS','LOP_BEGIN_XACT','LOP_COMMIT_XACT')
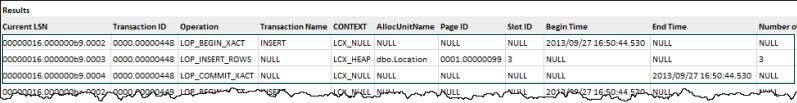
Your output will look something like the above screenshot after running the above script.
Let's see how we can read the output. You can see the highlighted area which we will read as:
- INSERT statement with transaction ID 0000:00000448
- started at 2013/09/27 16:50:44:530
- INSERTed a row in a HEAP table 'dbo.Location' in pageID 0001:00000099
- finished at 2013/09/27 16:50:44:530
Similarly, it will show you this same kind of information for UPDATE and DELETE statements.
Finding internal SQL Server operations in transaction log
We can also check internal functions of SQL Server through this function. Let's take for example page splitting. We can track all info about page splits like how many times page splits occur, on which page and during which operation. Let's take a look at this below to see page splits for the above INSERT operation. Run the below SQL code to get all operations related to page splits.
USE ReadingDBLog
go
--Get how many times page split occurs.
SELECT
 [Current LSN],
 [Transaction ID],
 [Operation],
  [Transaction Name],
 [CONTEXT],
 [AllocUnitName],
 [Page ID],
 [Slot ID],
 [Begin Time],
 [End Time],
 [Number of Locks],
 [Lock Information]
FROM sys.fn_dblog(NULL,NULL)
WHERE [Transaction Name]='SplitPage'
GO
--Get what all steps SQL Server performs during a single Page Split occurrence.
SELECT
 [Current LSN],
 [Transaction ID],
 [Operation],
  [Transaction Name],
 [CONTEXT],
 [AllocUnitName],
 [Page ID],
 [Slot ID],
 [Begin Time],
 [End Time],
 [Number of Locks],
 [Lock Information]
FROM sys.fn_dblog(NULL,NULL)
WHERE [Transaction ID]='0000:00000451'
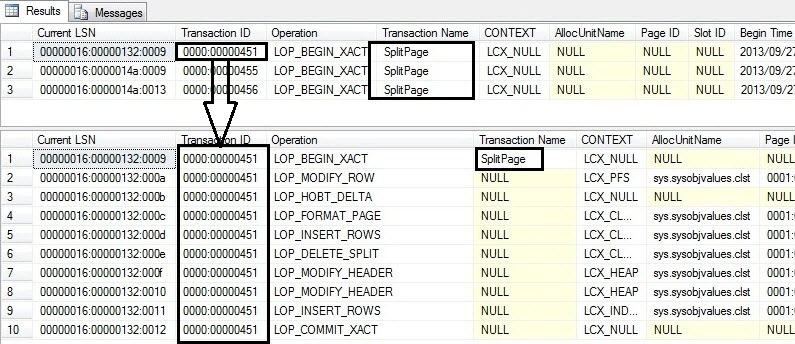
As you can see above Page Split occur three times for the above DML activity. The first script will let us know how many times page splits occurred and the second script elaborates on the internal processes SQL Server ran during a single Page Split operation. The above image takes the first page split, transaction ID '0000:00000451', and shows all internal processes in the second result set.
Similarly if you drop any object or you perform other database operations they will get logged in the transaction log file which will then be visible using this function.
How a backup interacts with the transaction log
Now I will run a backup and see the transaction log file again. Run a backup on this database and then again check the transaction log file.
SELECT COUNT(*)
FROM fn_dblog(null,null)
GO
BACKUP DATABASE ReadingDBLog TO DISK = 'c:\ReadingDBLog_Full.bak'
GO
SELECT COUNT(*)
FROM fn_dblog(null,null)
GO
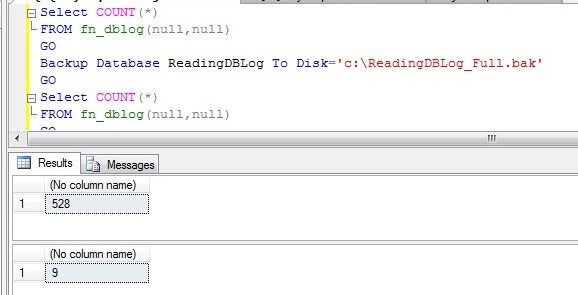
As we can see, the number of rows has been drastically reduced after doing a backup and it has been reduced to 9 rows from 528. This means the inactive part of the log which tracked the transactions has been dumped to a backup file and the original entries from the log file have been flushed. Now you can shrink the log file if necessary.
Other things you can do
You can also use the DBCC Log() command to see log information, but this command will not give you detail information. You can also use trace flag 2537 to look at all logs and not just the active log.
Next Steps
- Use this function to research transaction activity.
- There is a lot of information you can get from this function and there are more than 100 columns that you can use.
- Use this data and also correlate with other data that you collect on your server.
- Explore more tips on SQL Server Database Administration
Last Update: 2013-10-31
'Database > MS-SQL' 카테고리의 다른 글
| [스크랩] 트랜잭션 로그 백업을 읽고 트랜잭션 발생 시간 및 사용자 찾기 (0) | 2018.07.08 |
|---|---|
| [스크랩] SQL Server 트랜잭션 로그 아키텍처 및 관리 가이드 (0) | 2018.07.08 |
| ★ MSSQL 이관 작업 STEP (0) | 2018.07.08 |
| [스크랩] DB 로그인 정보 이관 (0) | 2018.07.08 |
| MSSQL 로그인정보 확인 (생성일, 수정일 등) (0) | 2018.01.23 |